

Raise Your AiQ: Human Behavior Drives Outcomes. We Call It Seasonality.
Top-Down Trading: Macro Forces to the Grain Moves

Many agricultural traders and analysts view seasonality as little more than a reflection of the calendar. For instance, crude oil demand rises during the summer months as more people take vacations and spend time driving. Similarly, the soybean basis and futures strengthen as old crop supplies dwindle.

The effect is quite similar to corn, but lags, as the planting and harvest schedules would suggest.

Seasonality is everywhere around us. It affects most big decisions we make.
An individual’s most important financial decisions, such as home investments, follow the calendar to a T. Even famous stock market mnemonics like “sell in May and go away” are based on data that shows the best performance comes after Halloween.

If demand is seasonal and listings follow demand, then it should be no surprise that the appreciation of your home is seasonal — not simply cumulative. See the normal downtrend post-August.

If you are brave enough to buck these trends, it will probably cost you. The more often you ignore seasonals, the less likely the odds are in your favor.

Consumer spending, travel, construction, sports, etc., influence our behaviors consciously and subconsciously.
While these patterns are broadly accurate, this interpretation leads to a critical misconception: seasonal trends display minimal deviation and remain highly consistent, barring major exogenous shocks. Even one-off weather events like hurricanes are seasonal and can be modeled over extended periods.
Traders can sit back and wait for the calendar to work its magic, trying to figure out why this year is different.
Seasonality is not driven merely by the calendar or slight variations in the timing of events — it is rooted in the collective behavior of humans. The underlying force behind these recurring patterns is the way groups of people respond predictably over rolling 12-month periods.
The calendar offers a framework, but it's modeling human behavior through data that truly drives accurate predictions.
Data should be seasonally adjusted whenever possible. This is common in most economic statistics, from employment to trade data. Take China’s export below. Is February a “bad” month for exports each year? Of course not, it’s China’s Lunar New Year, so the volumes will halve. Skeleton crews man facilities, while most of the country takes its annual break or pilgrimage home. Eve

We broke out the seasonal influence by month on corn basis at a Midwest location. Interestingly, February’s seasonal influence is less bearish than January or March. Any ideas why?

A recent post by Angie on X prompted me to think deeper about this concept.

Humans are wired to ask, "What can I get ahead of?" A built-in survival instinct that drives behavior, especially under perceived threats. Sending your kids to school with insufficient supplies creates family tension and puts them at a perceived disadvantage. Not exactly “survival,” but not far off either, when it seems like the end of the world to your child.
Inflation, business cycles, and recessions operate on a similar principle, just dressed in different costumes.
It wasn’t the normal cause of inflation; it was the supply chain this time.
There was a great analogy floating around the internet (I couldn't track down the original author, so credit is due), which compares supply chains to fine dining. When everything runs smoothly, it's elegant and seamless — the kitchen staff, waiters, and suppliers all working in perfect coordination behind the scenes. But when one piece breaks down, the entire experience quickly unravels, leaving customers furious.

This is why our focus and energy need to be on outcomes, not why this time was different.
Here is a quick anecdote from a recent client.
Client: “You were right; the poor weather is showing up in firmer basis. But we were also correct about waiting.”
Me: “How do you know that?”
Client: “It looks like we low-ticked the market.”
Me: “What is your market share in that region?”
Client: “Significant, greater than two-thirds at multiple locations.”
Do you see the catch-22? The client is usually the market. Producers have a smaller crop due to challenging weather conditions the previous summer. They will be more hesitant to market aggressively; therefore, the low is in once the client starts buying.
Further, due to their market share, no worthwhile backtest or post-mortem analysis can reflect the local cash market without the client’s influence. Historical data and backtesting cannot remove the footprint of a dominant player.
In backtesting for quantitative strategies, this is known as “impact bias.” It is most pronounced with high volume strategies or illiquid markets. Cash markets and large players fall into the latter category.

Seasonality Should be Viewed Through the Lens of Timing & Outcomes
Seasonality is a 12-month rolling regime anticipated by traders as early as possible. The more acute a weather anomaly in one hemisphere, the quicker traders front-run it in the other. We don’t skip buying our kids’ school supplies; we react faster. Advancements in data availability, machine learning, and computational power are accelerating the pace of these cycles with each passing year.
Each season is different. True ✅
Every recession is different. True ✅
The causes of this inflation regime are different. True ✅
This bullish commodity cycle is different. True ✅
The human reaction function is different. False ❌
The waterfall effects in markets are different. False ❌
The knock-down effects avalanche from one market to the next. Recessions may start for different reasons, but consumer spending only happens in one direction once a recession begins. The next question becomes when and how it will manifest in the data?
These famous sayings come from human behavior and the collective effects on financial markets.
“The market can stay irrational longer than you can stay solvent.”
“History doesn’t repeat itself, but it often rhymes.”
“Don’t fight the tape.”
“The four most dangerous words in investing are: ‘this time is different.’”
“Price is what you pay, value is what you get.”
Think about that last quote for a minute. Warren Buffett became the world’s greatest investor by doing the opposite of others. When they got greedy, he went to cash. He bought businesses that had been cast aside and sold them when markets were paying premiums. Value is what you own; price is what the collective mob determines at a point in time.
Essentially, the outcomes that cascade from one market to the next in a recession or inflationary regime shift are when he is looking to take sizable positions in the opposite direction. Talk about the ultimate grasp of human forces at work.
Inflationary Regime Shifts Are About Outcomes
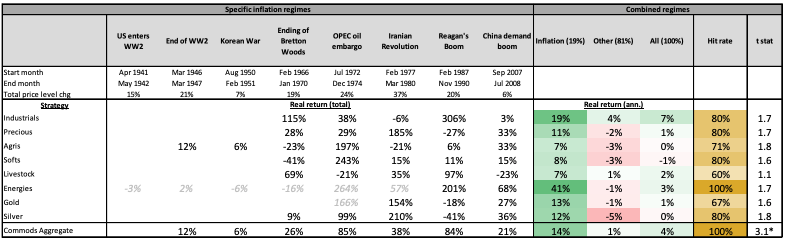
Moves in one market have downstream effects on the next and the next market after that. The charts below are from the paper The Best Strategies for Inflationary Times (paper here). The authors looked back at the market’s reaction and asset prices during each inflationary regime over the last 100 years (19% of the time).
The main takeaway is that many of these “inflationary periods had different causes, but the investors and citizens did not care. Prices rose, and changed behaviors. Investors came to understand that the investment landscape had changed and reallocated their portfolios.
The first three periods of inflation shown below were due to war funding, while the most recent cited was the tail-end of the mortgage/commodity bubble in 2007/08.
Components of CPI Basket During Inflationary Regimes

Inflation rate of change and real equity returns.
Gold is below median starting inflation, and blue is above median starting inflation.

Commodity performance during inflationary regimes
The most consistent indicator of periods when commodities outperform other assets.
Trend following strategies
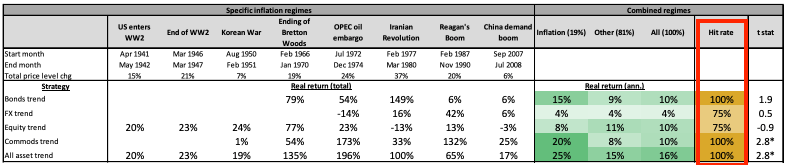
A Quick Tangent for Trend Following Strategies
It should be self-evident why trend-following strategies have maintained such widespread utility. Traders can model the impact of the current regime and seasonality while projecting forward the likely sequencing of market behavior. As long as the prevailing regime persists, a high beta (potentially alpha) exists to be harvested.
Commodity traders will undoubtedly highlight the Russian invasion’s disruptive role on global supply chains. However, it should be equally apparent that the resulting outcomes were amplified by the accelerating inflationary environment that had begun a year earlier.
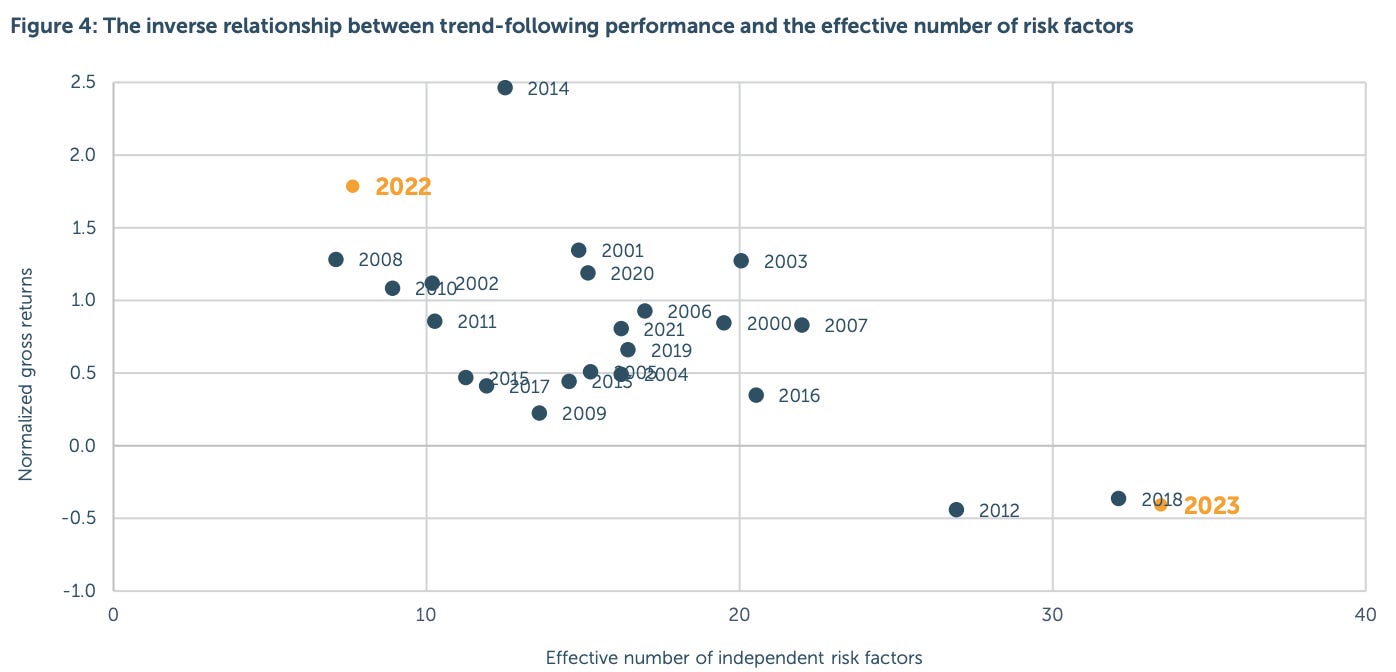
This paper from Quantica Capital underscores the stark contrast between trend following performance in 2022 and 2023. It is hardly surprising that once the inflationary regime collapsed, the same strategies that had delivered outsized returns reversed — from best to worst in a year.
In this research note, we explore the relationship between trend-following CTA performance and the number of independent risk factors required to explain such performance. More specifically, we show that historically, trend-following CTA performance has been strongest when trends were primarily driven by only a few systemic global cross-asset risk factors, such as in 2022 (or 2008).
Trend following is one of the most popular trading strategies because it works. The embedded assumption is that price reflects all of the collective knowledge of a market.
Think about a normal year — bullish or bearish. Tight global supplies have a function to force rationing and incentivize production, but it often takes continuous seasons to address shortages.
Wheat is the most commonly grown staple crop in the world. Wheat became the most profitable crop for every producer who could grow it overnight. Buyers were fixated on the potential for shortages and the risk of shutting down the Black Sea export capacity. That spring, the weather in Russia turned out to be fantastic. Ultimately, production rose 12-15 mmt from post-war estimates. Wheat has made new lows continuously for 3 years.

Moves Will Waterfall or Cascade
Bullish moves will cascade into other markets in a virtuous feedback loop, and speculators will increase bets until a strong enough catalyst stops the trend. Trends, once established, will carry on for months or years. The fewer signals/drivers, the better the performance.
Another unique factor is that commodities offer opportunities for long and short players. There is an offsetting long (the producer of crude oil) for each natural short (an airline or shipping company) in the marketplace. Commodities will find an equilibrium, similar to when crude went negative or cocoa shot to the moon.
The potential for overshoots in both directions makes long/short trend following even more appealing than other asset classes, such as equities or interest rates.
There is no natural short in the equity space, and they spend roughly three quarters of the time posting positive returns. Shorting equities is not profitable, and especially not in the age of “active monetary intervention” (post-GFC).
Consider that there have only been three recessions in the last 36 years. All were short-lived — not enough time for trend following strategies to get short and let compounding losses drive the subsequent waves of selling. We did get a glimpse in 2008 when commodities lost more than half their value during the unraveling of the GFC.

Notably, this paper, published in March 2021, does not account for the inflationary episode that emerged from late 2020 into 2023, following the unprecedented fiscal interventions enacted by central banks in response to the COVID-19 pandemic and the deficit spending.
The willingness of Central Bankers to use the full force of their balance sheets to backstop markets has certainly reduced the amount and severity of recessions since the 1980s.
The result is a more fragile market, not antifragile, as Treasury Bessent claimed this week. The reason is debt. The mountain of debt developed economies have accumulated was the trade-off to ensure hard times are pushed out into the future, delaying possible deleveraging scenarios.
Two Examples: Cocoa’s ATH & Argy Farmer Selling
Cocoa was a great example of a trend-following favorite. While commodity traders tried to find “fair value” or the price at which margin destruction would kill demand, CTAs stayed long. Prices went up roughly 4 - 5x in a year. Multiples higher than most analysts thought possible.

Cocoa follows a much longer production cycle than typical row crops. Once planted, a cocoa tree requires 3 to 5 years before yielding its first full harvest. After this initial phase, peak production can last up to 20 years, and each tree can produce pods for decades (assuming proper care).
Cocoa is primarily grown in West Africa and sunny climates like rural Indonesia and Ecuador. These areas face persistent challenges such as underinvestment, theft, political instability, and unsustainable harvesting practices. These factors can severely disrupt production cycles, leading to long-term supply volatility and quality issues.
Argentina is another example. The average producer has few options when handling and storing crops to meet cash needs. Hence, local traders know exactly how much grain should move based on the crop size.
Seasonality in Argentina shifted materially due to government policies that drove inflation and eroded the purchasing power of farmers. Money was not considered safe in banks, so farmers responded by storing their grain on the farm and refusing to sell.

Macro policies forced liquidity from the marketplace, leading to lower realized prices and business grinding to a halt. This is the first campaign since the disastrous policies of the Kirchner government, and lower post-harvest prices are a result of farmers delivering grain rather than holding it.

Listen to this interview with Julian Roberts as he talks about producer behavior. Traders in Argentina expect 25% of the crop to be sold by the end of June. It’s not a question of whether farmers sell, it’s a question of when. Traders might be off by a few percent from one campaign to the next, but most of this is a function of crop size.
Here are a few of the drivers:
Cash needs: pay off debts from the current campaign and raise cash for the upcoming season.
Harvest timing: Few producers have their equipment. While farms are smaller than those in Brazil or Paraguay, farmers have limited storage and equipment; much of the work is outsourced to harvest crews rotating across the country.
Competition from Paraguay: By the time Argentina’s harvest is well underway, soybeans are flowing down the river from Paraguay, and north Brazil’s export program is underway.
Government cash flows: The currencies in export-driven economies have strong seasonal trends. This is because exporters need to convert foreign currencies to local (BRL, ARS, RUB,), and currencies strengthen on investor comfort from positive trade balances. Only the US can run massive current account deficits with little penalty — this may be changing.
AiQ’s Framework: Macro Drives Liquidity and Data Reflects Human Nature
AiQ’s theme is from “Macro Forces to the Grain Moves” because liquidity drives markets. The macro refers to the big picture or markets that drive global money flows. These are events that drive government and central bank policies.
Monetary policies: Is the Fed tightening or loosening rates, QE, etc.
Fiscal policies: Are governments deficit spending, extending credit, encouraging speculation, providing direct/indirect stimulus, etc.
Is the regime inflationary, risk-on/risk-off, slowing growth, etc.?
Exogenous shocks: Pandemics, recessions, wars, famines, etc.
Below is a chart that shows the price of crude oil (brown) and the University of Michigan Inflation Expectations. This chart is the chicken and the egg allegory. High energy prices can drive inflation, but inflation expectations will encourage crude oil buying as a speculative bet or hedge to manage risks. For our purpose, we don’t care about which caused which; we care about the outcome. Is more money flowing into or out of commodities?

To form a complete view of the market, it's essential to combine a macro perspective with a data-driven understanding of seasonality. By layering insights from broader economic forces with what the data reveals about historical patterns, we gain a clearer picture of how markets might evolve. It’s equally important to assess how key participants — whether farmers, commercial hedgers, or trend-following CTAs — are positioned or reacting to current shifts.
These behaviors reinforce the price trends, and once the trends are established, they cascade into other markets. While there may be a different driver this time, the outcomes are always similar in the end. This is why we stay focused on data and outcomes.

Ultimately, having a strong opinion on whether prices should go up or down means little without the tools to track liquidity flows and human behavior within each market. In today’s environment, actionable insight comes not from conviction alone, but from the ability to model reactions, measure positioning, and understand the impacts the liquidity will have.
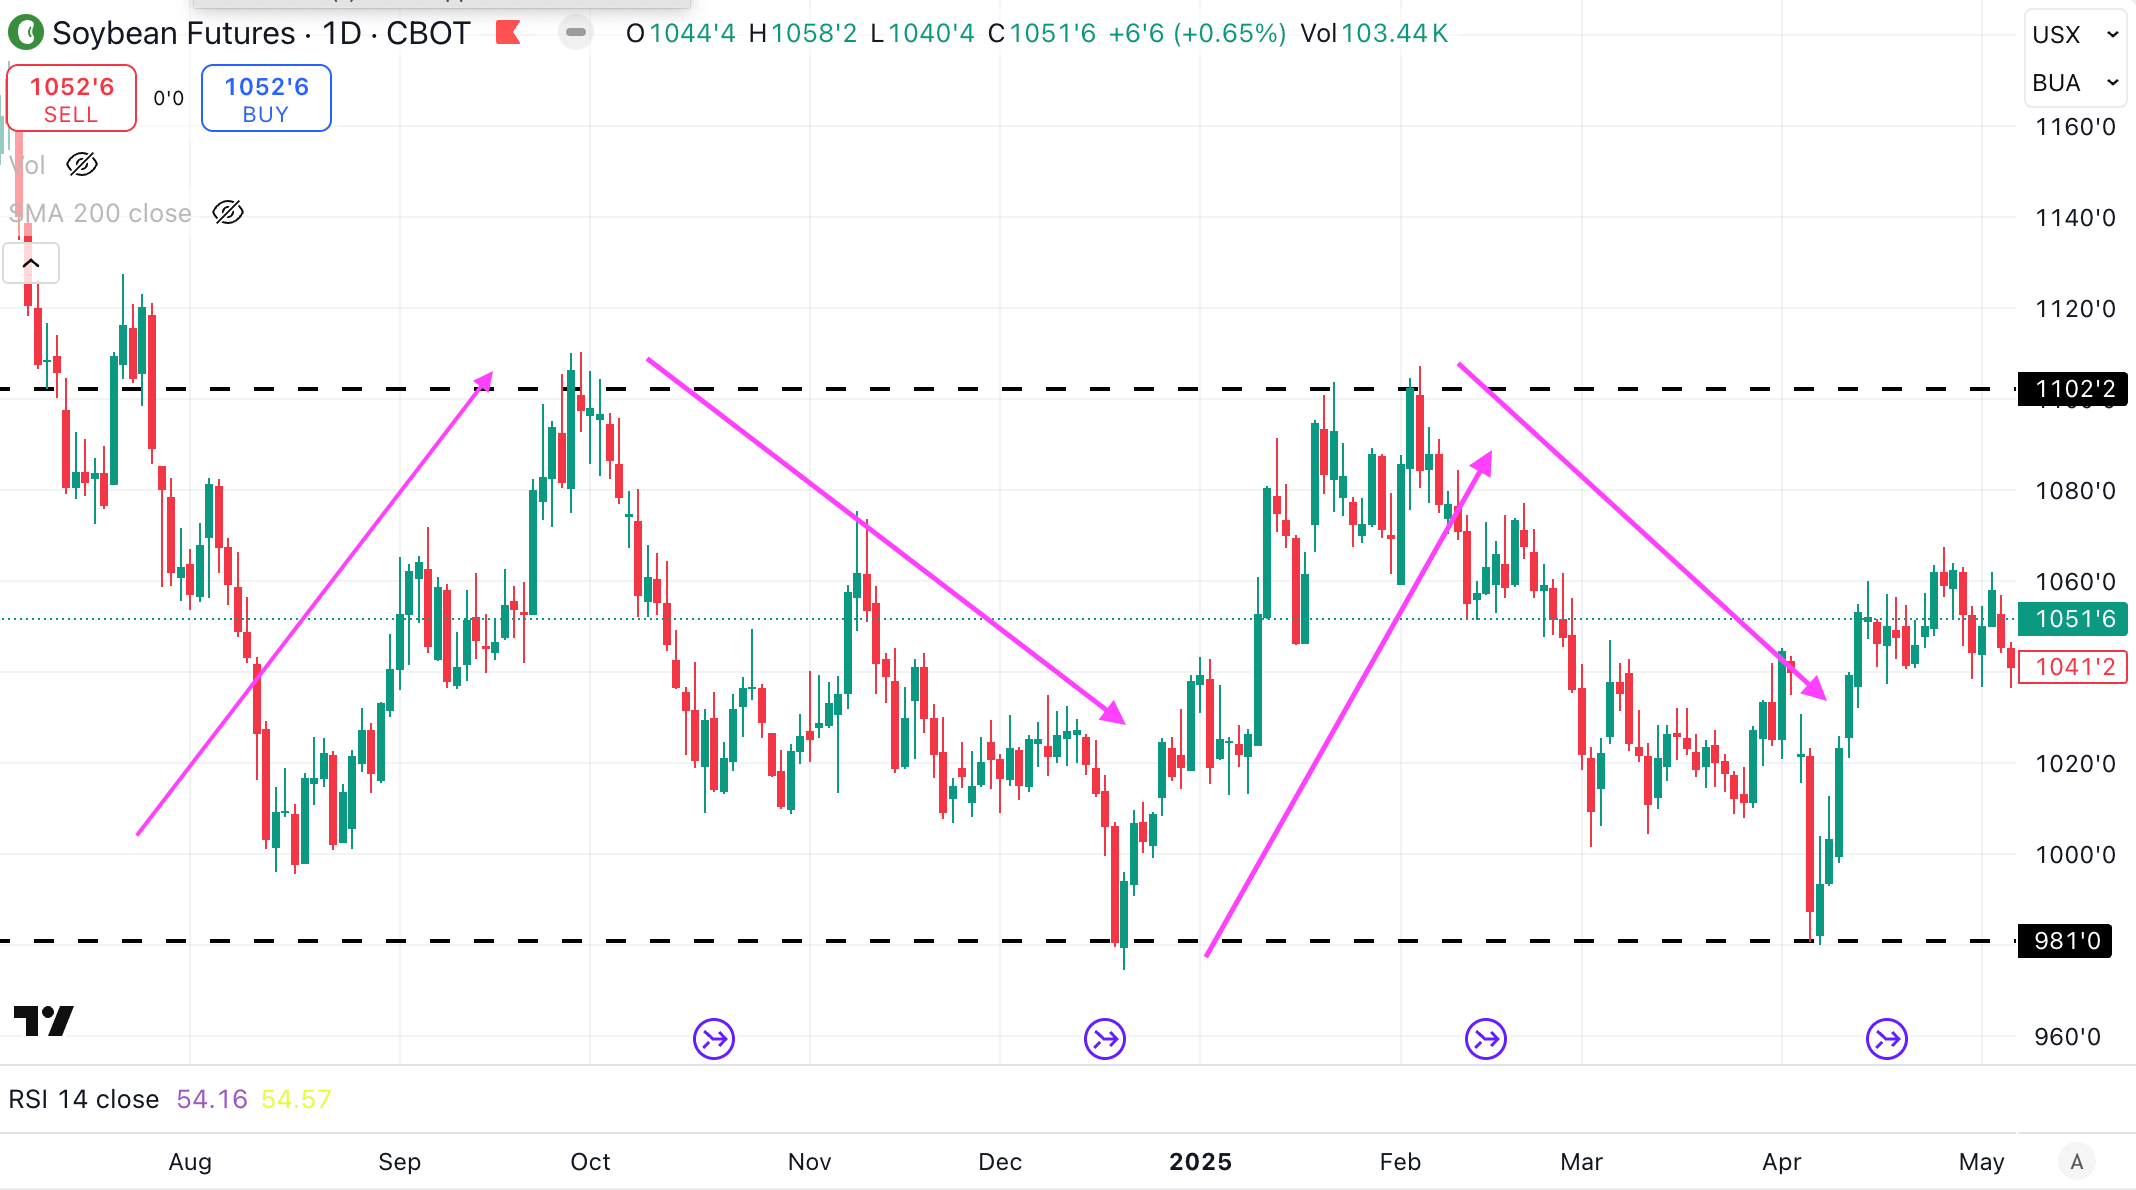
Look no further than soybeans. They have traded the seasonal weather patterns within a fairly tight historical range, while traders with dogmatic views, bullish or bearish, have been chopped up on both sides.
Thank you for reading. Please reach out to Nico@archaiq.ai with any suggestions on how to improve our products or if you're interested in exploring new opportunities with ArchaiQ. Sign up for our free weekly newsletter at www.archaiq.ai.
This is not trading or investment advice. Trading Futures is a high-risk activity; please consult with a professional.