Is Brazil’s “Monster” Corn Crop for Real? A Data-Driven Look at Safriña Yields
A 150 MMT Brazilian corn estimate caught traders and social media off guard. Could they be right?
Yesterday, Ag X lit up after Agroconsult released a 123.3 MMT Safriña corn estimate—a number that sparked plenty of excitement and some healthy skepticism.
We’ve all heard the old saying, “big crops get bigger,” but the recent version has been:
”Extreme crops get even more extreme… on social media.” Traders were skeptical, and analysts shook their heads. Not again.
In this note, we’ll walk through:
AiQ’s starting point in the “Modern Brazil”
How likely is a 123.3 Safriña crop, statistically?
Does the weather data justify a potential Monster?
Here is the article. The highlights are a 123.3 crop across 18.1 M ha, and a national yield of 6.81 mt/ha. To keep this in perspective, the largest yielding countries are above 11 mt/ha on average.
First, a Word on Modeling
Models are built on history. They’re trained on past datasets with defined parameters, and that introduces limitations. Most models—especially those used in ag forecasting—tend to underestimate tail events. That’s not a bug; it’s a feature of using normal distributions and trends. They work well most of the time.
But to model the less likely but highly impactful outcomes, we turn to concepts like Levy distributions—which place much more weight on the extremes.
In the chart below, the red line shows a Levy distribution overlaid on the familiar bell curve. Notice how the tails are fatter—indicating a higher probability of outlier events, both good and bad. In cumulative terms, that also means more area under the curve in the extremes and less around the middle.
Corn yields in volatile growing regions—like Brazil—are inherently more prone to surprises. The reasons are simple: shifts in planted area, improvements in seed genetics, rapid adoption of technology, and, of course, highly variable weather.
Keep in mind: Brazil’s entire historical record for corn is 50 data points. That’s not much to build statistical certainty on, especially when modeling a crop as volatile as Safriña.
Now, a word on the commentary that had traders offside from the start. More on this bias we encounter often at the bottom.
Back in March, we raised concerns about some of the early-season narratives. In particular, Commodity Weather Group’s claim that Brazil’s second corn crop was off to one of the worst starts ever didn’t sit well with us. We flagged the late planting risk due to a wet February and cut our estimates early. But then, favorable weather kicked in—and our models responded, ratcheting the numbers up as the season progressed.
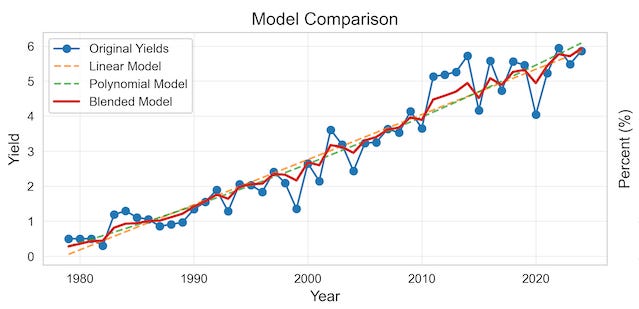
As of now, AiQ’s projection for Brazil’s total corn crop is 136.5 MMT, with Safriña contributing 111 MMT. This breaks down to 6.13 mt/ha or about one standard deviation below Agroconsult’s. The graph below shows “yield potential,” which we consider each season—representing normal to good weather (6.09 vs. 5.86 trend).
A detail that is hard to see in this graph is the polynomial (green) outpacing the linear (orange) model since about 2013. This is even with an 18% yield yield loss in 2020. Polynomial models can represent paradigm shits such as accelerating or plateauing production—exactly what the data suggests in Brazil.
The most obvious driver of higher yields is innovation. Better capitalized producers can access improved seed genetics, more precise machinery, and cutting-edge inputs. The yield gains aren’t magic—they’re math. It’s the compounding effect of yearly marginal improvements across millions of hectares.
The bottom line is that we can’t rule out a 123 MMT, but there’s more to it. Let’s dig into the data and see what story the numbers really tell.
Safriña Yields & Precipitation Anomalies
Let’s save everyone some time and get straight to the point because there are more interesting things to discuss. Brazil’s last four decades of corn yields and weather anomalies show an R-squared of zero. Statistically, this means the weather has no impact. That, or we’re asking the wrong questions.
Keep reading with a 7-day free trial
Subscribe to Nico AiQ to keep reading this post and get 7 days of free access to the full post archives.


