"Show me the man and I'll show you the crime"
-Lavrentiy Beria
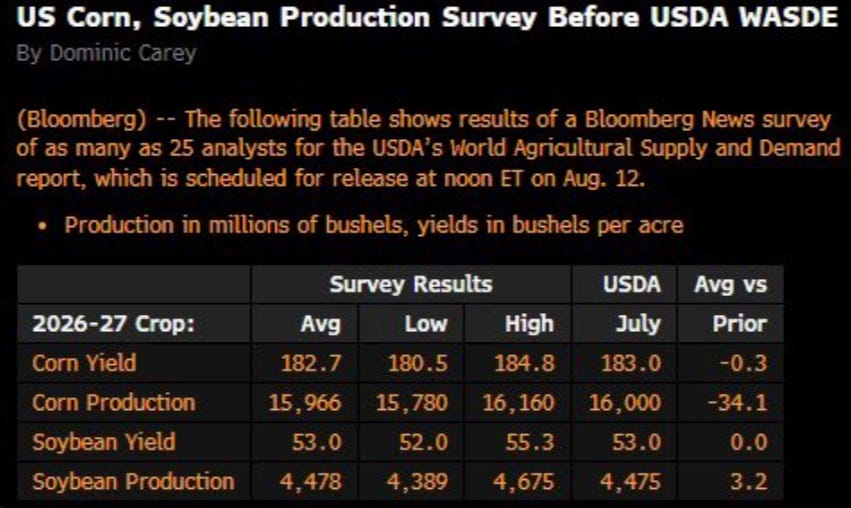
Below are your Survey results ahead of Wednesday’s WASDE. I don’t expect notable yield adjustments from this report. Below we explain why.
The DTN Digital Yield Tour kicked off Monday. That’s a strange sentence to write since it’s computer code and data-fed, or at least one would assume.
It could kick off a week ago, a month ago, or have been running continuously since last year with limited value; there isn’t really any reason to “kick it off.”
This model seems more credible than most of the guesses we’ve seen this season, and I have no idea of its history. Apparently it’s the first one. I don’t know.
At least it resembles what actually happened with the weather, not another overfitted mental model chasing prices. I periodically try to lead the yield guessers to water, but I can’t make them drink.

Anyhow, DTN’s output caught my eye because of a word used a few times: variable. Variable as in reference to weather volatility and uncertainty.
That’s exactly what we’ve been saying about the crop since the weather turned in late June. It would be uneven, and the areas that stayed dry since spring or got very hot would suffer significant damage, while being near impossible to quantify with confidence.
With confidence being the key phrase in that last sentence due to the magnitude of weather changes.
Soybeans had more downside, but corn sustained more damage before forecasts began improving Monday, July 27.
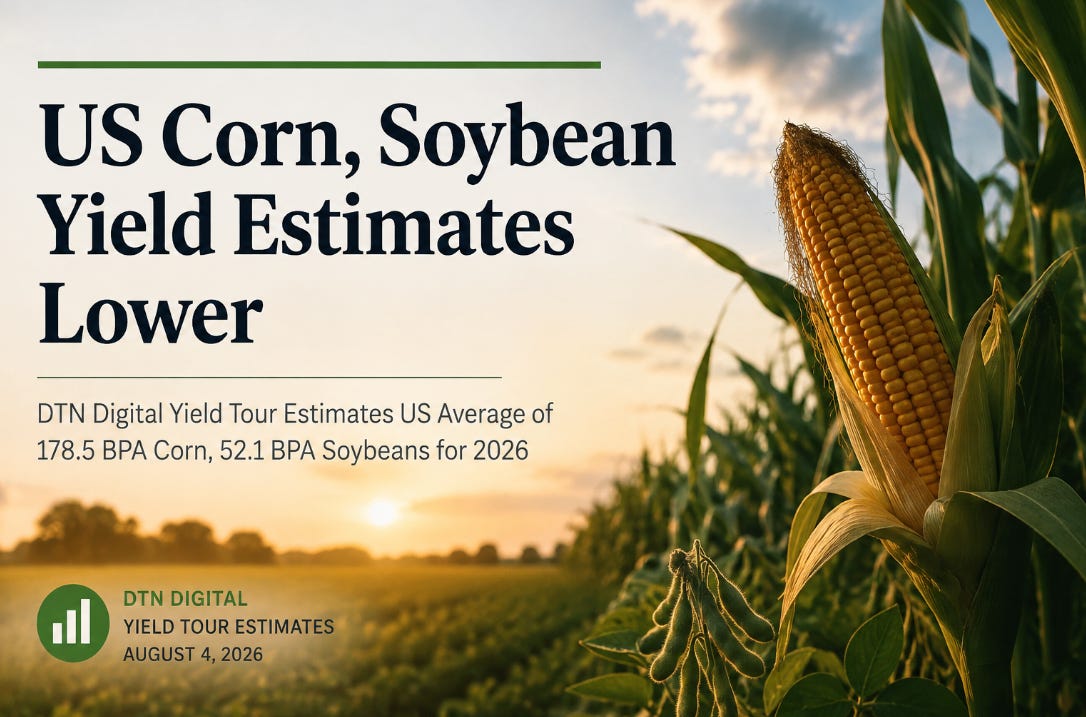
The 2026 DTN Digital Yield Tour kicked off Monday, Aug. 10, with the release of the tour’s first-ever national yield estimates. According to yield models as of Aug. 1, DTN predicts a national average corn yield of 178.5 bushels per acre (bpa) and an average soybean yield of 52.1 bpa in 2026.
Last month, in its World Agricultural Supply and Demand Estimates (WASDE) report, USDA estimated national average corn yield at 183.0 bpa for the season, while national average soybean yield was pegged at 53.0 bpa. These USDA projections are based on a weather-adjusted trend assuming normal planting progress and summer growing season weather. The DTN models update every two weeks and do not incorporate weather forecasts…
According to DTN Ag Meteorologist John Baranick, the weather this growing season has been variable, but that was expected.
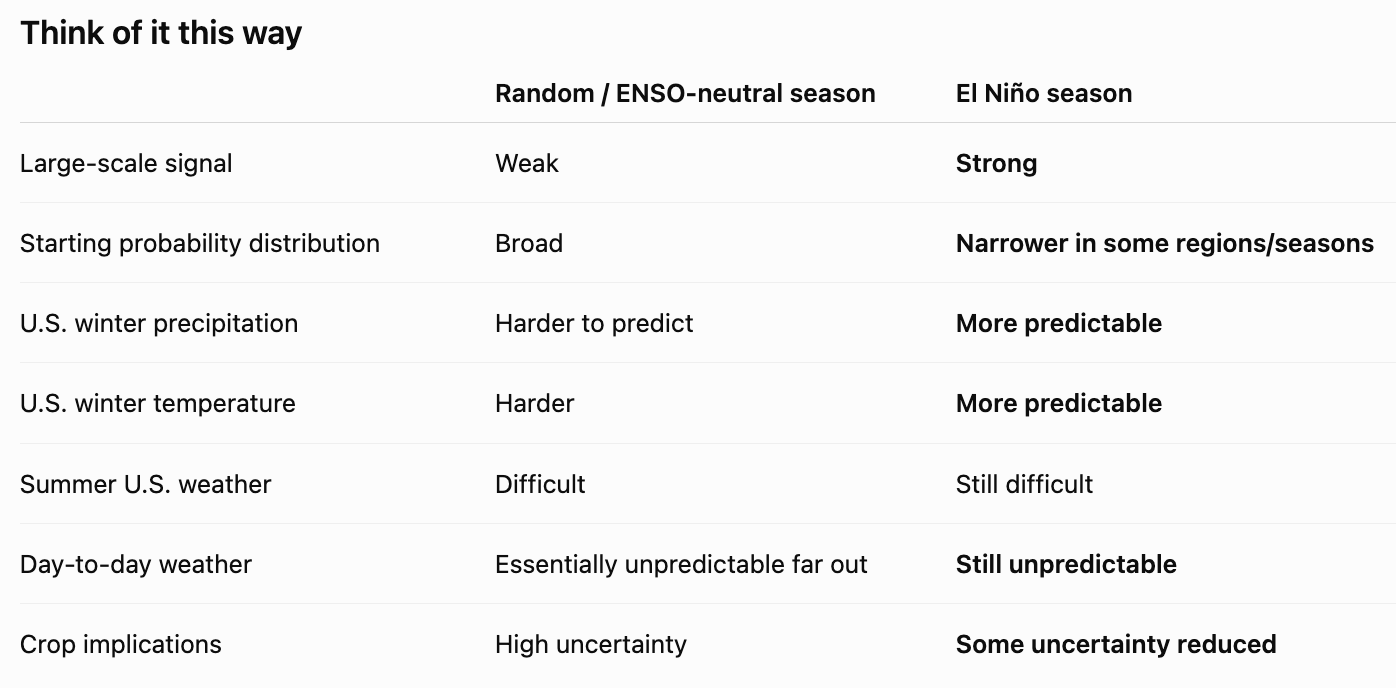
“With El Nino building in the Pacific Ocean, that generally leads to a lot of activity across the middle of the U.S.,” he said. “But no two El Nino years are the same, and this one certainly was not like any we have seen before.”
Well done, DTN. I don’t know their track record and don’t care; at least somebody finally put out figures that directionally resemble the realized weather and data over the last 60 days. Corn’s number is probably not right. Maybe eventually.
The ratio of corn and beans relative to trends (2.5% v 1.7%) suggests the math is proportionately correct. Not necessarily directionally.
Others do stuff like this too, and you’d be better off throwing a dart. It would be hard to be less precise than this.
Literally, just ask the free ChatGPT. Don’t do this.


Not Random. Ever.
Weather is not random; it’s uncertain. There’s a 50% chance the summer will be wetter or drier than average in a normal year. That’s why systematic (probability-determined) traders carry a short bias in grains during an El Niño year.