

Can ENSO predict grain yields across the central US? A 2025 Perspective
Miguel is a Midwest Based Expert With a Passion for Data and Agriculture

As of mid-2025, the equatorial Pacific Ocean is under ENSO-neutral conditions, meaning there is no active El Niño or La Niña phase. NOAA projects that these neutral conditions will likely persist through the summer and potentially into the fall, though there remains some chance of La Niña development by year-end.
What is ENSO, and why does it matter?

ENSO — the El Niño–Southern Oscillation — refers to periodic warming or cooling of sea surface temperatures in the equatorial Pacific Ocean. These changes influence atmospheric patterns around the world. In North America, ENSO phases tend to shift the jet stream, alter precipitation and temperature patterns, and impact growing season conditions across the central U.S.
ENSO first became a household name in the 1980s, and today, remains one of the most talked about climate drivers affecting North American agriculture.
Is ENSO actually a reliable predictor of grain yields?
Given its climate influence, ENSO often sets a narrative for the growing season. But is it a silver bullet for forecasting grain yields? The short answer: no. History shows that ENSO alone is not a reliable predictor of yield outcomes. While it provides valuable context, its predictive power has limits, especially when real-world outcomes diverge from climatological expectations.
Here’s a general rule-of-thumb with ENSO and how it can affect grain yields, particularly corn and soy:
Why can El Niño hurt corn but help soy?
During an El Niño, the U.S. tends to have a wetter spring (delayed planting) and a hotter, drier summer — especially in the Midwest. That’s bad news for corn, which is very sensitive to heat and dryness during its key pollination window in July. If it’s too hot or too dry then, corn yields can drop.
But soybeans, which develop later in the summer, often benefit from late-season rains that return during El Niño years. Since soybeans are less sensitive to early summer stress and more focused on August weather, they often end up doing better than corn in El Niño seasons.
Does the El Niño hurts corn but helps soy narrative always fit? No. And as we see in the data table below, 2023 was the last time this narrative really fit.
Why can La Niña hurt both corn and soy?
La Niña usually brings hotter and drier weather during the summer across much of the Corn Belt — and that’s tough on both corn and soybeans.
Corn suffers the most because it pollinates in July, when La Niña heat and drought can hit hardest, hurting kernel development and cutting yields. Soybeans aren’t as sensitive early on, but if the dryness drags into August — when pods are filling — they’ll also take a hit. La Niña can stack the deck against both crops by raising the risk of mid-to-late summer stress.
Does the La Niña hurts both corn and soy narrative always fit? Also no. And as we see in the data table below, 2011 was the last time this narrative really fit.
ENSO Phase - Grain Yield Relationship (1950-2023)
This report shows how U.S. corn and soybean yields have historically aligned with clear ENSO events, including both El Niño and La Niña phases. These years are defined based on NOAA's Oceanic Niño Index (ONI). Yield values are approximate and based on USDA records. In this report, a yield deviation within ±2% of the long-term trend is considered neutral. If yields behave as defined above in the diagram, it’s labeled a “Hit.” If yields defy those expectations, it’s a “Miss.”
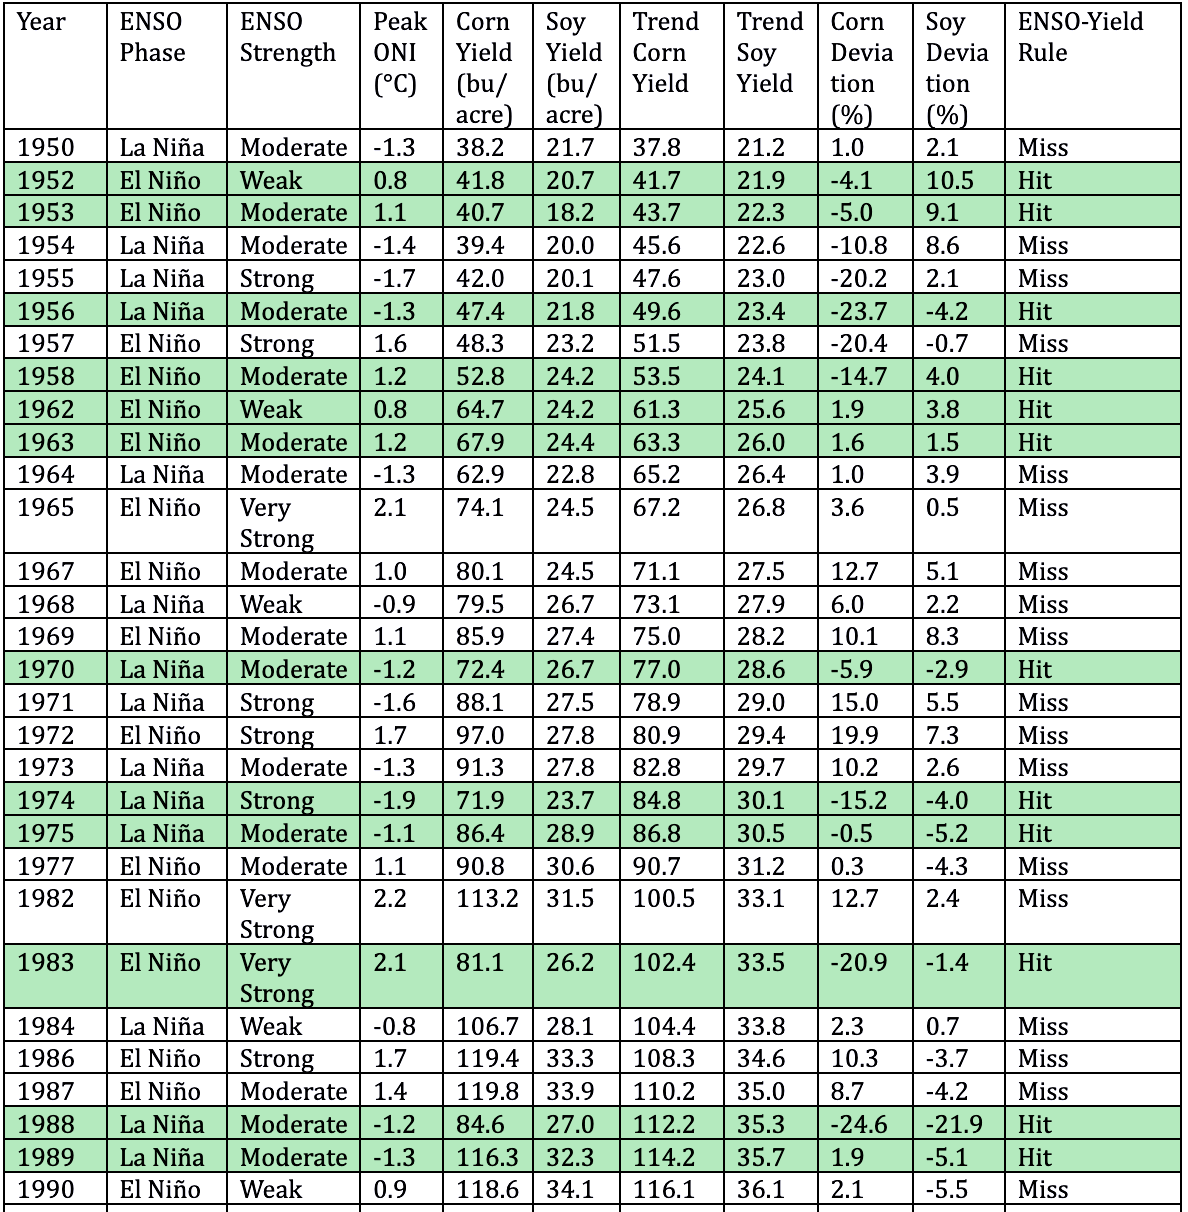
Sources: ENSO phase and ONI values from NOAA Climate Prediction Center (https://origin.cpc.ncep.noaa.gov/products/analysis_monitoring/ensostuff/ONI_v5.php). Corn and soybean yield data from USDA National Agricultural Statistics Service (https://www.nass.usda.gov). Trend yields calculated using linear regression (1950–2023).
When ENSO Got It Right – Hit
1988 – La Niña
Corn yield deviation: -24.6%
Soy yield deviation: -21.9%
2011 – La Niña
Corn yield deviation: -6.4%
Soy yield deviation: -4.6%
2023 – El Niño
Corn yield deviation: -1.9%
Soy yield deviation: 4.5%
When ENSO Got it Wrong – Miss
1991 – El Niño
Corn yield deviation: -8.0%
Soy yield deviation: -8.1%
2002 – El Niño
Corn yield deviation: -7.4%
Soy yield deviation: -6.3%
2016 – La Niña
Corn yield deviation: 4.5%
Soy yield deviation: 13.5%
Why 2012 Was Misremembered
Although 2012 was officially ENSO-neutral, many misremember it as a La Niña year because it began with residual La Niña conditions and featured classic La Niña-like drought impacts. However, the Pacific was neutral while the atmosphere behaved otherwise. An intense ridge over the Midwest produced one of the worst flash droughts ever recorded, devastating both corn and soybeans. This year underscores how atmospheric blocking and land feedbacks can override signals in the equatorial Pacific.
Corn yield deviation: -22.7%
Soy yield deviation: -9.7%
Why ENSO Sometimes Busts
Even strong ENSO signals can be disrupted by other atmospheric forces. Some key wildcard patterns include:
MJO (Madden–Julian Oscillation): A 30–60 day wave that can drive sudden wet or dry periods
Gulf Hurricanes: Can shift moisture trajectories or damage crops late in the season
Rossby Waves: High-altitude jet stream meanders that redirect storm tracks unpredictably
Pineapple Express: A surge of subtropical moisture from Hawaii that can override typical ENSO effects
These anomalies often override seasonal ENSO expectations and create on-the-ground conditions that no seasonal climate model can fully predict.
The Takeaway
ENSO provides a valuable lens through which to evaluate seasonal risk — but it's not a forecast guarantee. The historical data (1950-2023) shows that it “gets it right” about 43% of the time. And so ENSO should not be considered a silver bullet.
Here’s what we’re watching in Summer 2025:
NOAA’s latest forecast suggests neutral conditions are likely to persist through the core of the U.S. growing season, with only a modest chance of La Niña returning by fall. Since ENSO isn’t steering the ship in 2025, yield outcomes will be shaped by a patchwork of soil moisture trends, short-term heat bursts, and atmospheric pattern placement. In years like this, even small shifts in ridge alignment or timely rainfall can tip the balance between a good crop and a stressed one.
Soil moisture is mixed across the Corn Belt
The U.S. Drought Monitor shows moderate drought in parts of the western Corn Belt, while the eastern Corn Belt remains generally moist. Supporting this, NASA SPoRT root zone maps reveal emerging subsoil dryness in several key states. If early July turns hot, these deficits could intensify quickly — especially during corn's critical pollination window.
The Madden–Julian Oscillation (MJO) is weak
Recent CPC analysis shows the MJO is currently weak and disorganized, offering little help in steering large-scale rainfall or suppressing heat. This limits the tropical Pacific’s ability to shape jet stream patterns, increasing reliance on shorter-term forecasts.
Subseasonal forecasts carry added weight
With ENSO offering no strong signal, NOAA’s 2–4 week outlooks become a vital tool. Their mid-summer temperature and precipitation forecasts will help indicate whether July leans hot and dry — a key risk period for corn — or whether August may bring relief for soybeans.
Jet stream and ridge placement will drive yield outcomes
Without El Niño or La Niña to guide upper-level flow, much depends on where the summer ridge — including the monsoonal high — sets up. If it shifts east into the central U.S., it could anchor a hot, stagnant dome that suppresses storms and amplifies drought. But if it remains over the Southwest, it may enhance Gulf moisture transport and boost rainfall in the Midwest.
Past neutral years reveal how volatile outcomes can be
ENSO-neutral summers like 1980 (yield disaster), 1993 (floods), 1996 (strong crop), and 2014 (mild and productive) remind us how variable these neutral seasons are.
With no clear oceanic guidance, 2025 will be defined by timing, regional heat, and local rainfall.
About Miguel. Raised in the Corn Belt, wired for weather. With a decade of forecasting split between the private and government sector, I chase patterns from the mesoscale to seasonal outlooks. I aim to combine my weather expertise with interests in big data and ag.
Sign up for our free weekly newsletter at www.archaiq.ai. We will add insights and comments on the latest trending topics each morning at our Substack chat.
This is not trading or investment advice. Trading Futures is a high-risk activity; please consult with a professional.